Using Matplotlib for Data Visualization#
Matplotlib is a powerful data visualization library for Python that provides a rich set of features for creating a wide variety of plots and charts.
Many other Python plotting libraries are built on top of Matplotlib including Seaborn, Plotly, Bokeh, Holoviews. Some key features of Matplotlib include:
Wide range of plot types: Matplotlib supports a wide range of plot types, including line plots, scatter plots, bar charts, histograms, pie charts, 3D plots, and more.
Customization: Matplotlib allows extensive customization of plot properties, including color, line style, markers, labels, and fonts.
Interactive visualization: Matplotlib can be used to create interactive plots with features such as zooming, panning, and hovering over data points.
Integration with other libraries: Matplotlib supports a variety of data types including
list,numpy.ndarray,pandas.Seriesandpandas.DataFrame.Publication quality plots: Matplotlib produces high-quality plots suitable for use in scientific publications, with support for vector graphics formats such as PDF and SVG.
1. First Plot#
Just as import numpy as np and import pandas as pd, there is a convention for importing
Matplotlib as well. Uniquely, we normally do not “import” the whole matplotlib package
but one of its module, pyplot like the following.
Oftentimes, you need to use numpy and pandas together with Matplotlib. So it is a good idea
to also import those two libraries. And when you do, you should follow this order.
import numpy as np
import pandas as pd
import matplotlib.pyplot as plt
Tip
Use magic command %matplotlib inline to render plots directly inside Python Notebook.
import numpy as np
import pandas as pd
import matplotlib.pyplot as plt

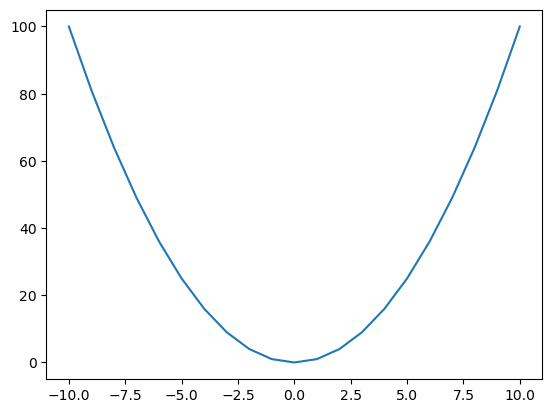
x = np.arange(-10, 11)
y = x**2

plt.plot(x, y)
plt.show()
2. Figure and axes#
In Matplotlib, a figure is a top-level container for all plot elements.
It can contain one or more axes (also known as subplots), each of which
is a container for a specific plot or graph.
A figure can have multiple subplots, arranged in a grid-like structure.
Subplots can be created using the subplots() function, which
take arguments to specify the number of rows and columns of subplots.
fig, axis = plt.subplots()
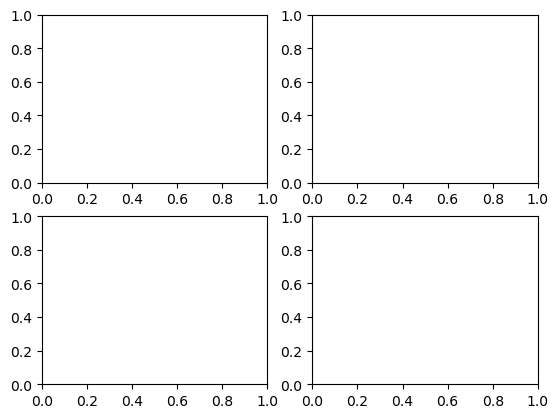
fig, axes = plt.subplots(nrows=2, ncols=2)
Now, let’s look at a concrete example in our class geodatabase.
import arcpy

gdb_worksp = r"..\data\class_data.gdb"
arcpy.env.workspace = gdb_worksp
blkgrp_fc = "blockgroups"
Recall how we convert feature class to numpy.ndarray and to pandas.DataFrame.
Let’s define a function for this conversion.
def fc_to_df(fc, fields=None):
    if fields is None:
        fields = [field.name for field in arcpy.ListFields(fc)]
        fields = fields[2:]  # ignore OID and SHAPE fields
    arr = arcpy.da.FeatureClassToNumPyArray(fc, fields)
    return pd.DataFrame(arr, columns=fields)
blkgrp_df = fc_to_df(blkgrp_fc)
blkgrp_df.head()
| STATEFP10 | COUNTYFP10 | TRACTCE10 | BLKGRPCE10 | GEOID10 | NAMELSAD10 | MTFCC10 | FUNCSTAT10 | ALAND10 | AWATER10 | ... | DEN_NOTATA | PCT_OWN5 | PCT_RENT5 | PCT_BACHLR | PCT_POV | PCT_RU1 | DATAYEAR | DESCRIPT | Shape_Length | Shape_Area | |
|---|---|---|---|---|---|---|---|---|---|---|---|---|---|---|---|---|---|---|---|---|---|
| 0 | 12 | 023 | 110903 | 2 | 120231109032 | Block Group 2 | G5030 | S | 57546992.0 | 57286.0 | ... | 0.000000 | 17.225951 | 62.878788 | 9.922481 | 23.488372 | 23.488372 | REDISTRICTING, SF1, ACS 2010 | 120231109032 | 33859.041797 | 5.760426e+07 |
| 1 | 12 | 023 | 110904 | 1 | 120231109041 | Block Group 1 | G5030 | S | 85591551.0 | 490327.0 | ... | 0.000329 | 26.212320 | 58.015267 | 5.456656 | 4.102167 | 4.102167 | REDISTRICTING, SF1, ACS 2010 | 120231109041 | 57228.368002 | 8.608197e+07 |
| 2 | 12 | 007 | 000300 | 5 | 120070003005 | Block Group 5 | G5030 | S | 196424609.0 | 217862.0 | ... | 0.000000 | 13.270142 | 68.181818 | 1.254613 | 10.701107 | 10.701107 | REDISTRICTING, SF1, ACS 2010 | 120070003005 | 75108.291194 | 1.966427e+08 |
| 3 | 12 | 007 | 000300 | 4 | 120070003004 | Block Group 4 | G5030 | S | 16339411.0 | 725167.0 | ... | 0.000000 | 18.924731 | 73.711340 | 12.617839 | 14.902103 | 14.902103 | REDISTRICTING, SF1, ACS 2010 | 120070003004 | 25941.067880 | 1.706462e+07 |
| 4 | 12 | 007 | 000300 | 1 | 120070003001 | Block Group 1 | G5030 | S | 57089369.0 | 3362134.0 | ... | 0.001138 | 22.957198 | 43.333333 | 1.134021 | 21.161826 | 21.161826 | REDISTRICTING, SF1, ACS 2010 | 120070003001 | 37132.065396 | 6.045165e+07 |
5 rows × 202 columns
blkgrp_df_short = fc_to_df(blkgrp_fc, ["GEOID10", "ALAND10", "TOTALPOP", "AVE_HH_SZ"])
blkgrp_df_short.head()
| GEOID10 | ALAND10 | TOTALPOP | AVE_HH_SZ | |
|---|---|---|---|---|
| 0 | 120231109032 | 57546992.0 | 2094 | 3 |
| 1 | 120231109041 | 85591551.0 | 2269 | 2 |
| 2 | 120070003005 | 196424609.0 | 1305 | 3 |
| 3 | 120070003004 | 16339411.0 | 1991 | 2 |
| 4 | 120070003001 | 57089369.0 | 2056 | 3 |
3. Scatter plot and basic plot settings#
The following statement returns all column names in a DataFrame as
a numpy.ndarray.
blkgrp_df.columns.values
array(['STATEFP10', 'COUNTYFP10', 'TRACTCE10', 'BLKGRPCE10', 'GEOID10',
       'NAMELSAD10', 'MTFCC10', 'FUNCSTAT10', 'ALAND10', 'AWATER10',
       'INTPTLAT10', 'INTPTLON10', 'SUMLEV', 'STATE', 'COUNTY', 'TRACT',
       'BLKGRP', 'ACRES', 'TOTALPOP', 'WHITE', 'BLACK', 'AMERI_ES',
       'HAWN_PI', 'ASIAN', 'OTHER', 'MULT_RACE', 'HISPANIC', 'NOT_HISP',
       'POP18', 'HSE_UNITS', 'OCCUPIED', 'VACANT', 'PCT_WHITE',
       'PCT_BLACK', 'PCT_AMERI', 'PCT_ASIAN', 'PCT_HAWN', 'PCT_OTHER',
       'PCT_MULTI', 'PCT_HISP', 'PCT_OVER18', 'PCT_OCC', 'PCT_VACANT',
       'DEN_POP', 'DEN_WHITE', 'DEN_BLACK', 'DEN_AMERI', 'DEN_HAWN',
       'DEN_ASIAN', 'DEN_OTHER', 'DEN_MULTI', 'DEN_HISP', 'DEN_OVER18',
       'HS_PER_AC', 'POPUNDER18', 'PCTUNDER18', 'DENUNDER18', 'WHITE_NH',
       'MINORITY', 'PCT_MNRTY', 'DEN_MNRTY', 'AGE_UNDER5', 'AGE_5_17',
       'AGE_18_21', 'AGE_22_29', 'AGE_30_39', 'AGE_40_49', 'AGE_50_64',
       'AGE_65_UP', 'AGE_65_74', 'AGE_75_84', 'AGE_85_UP', 'MED_AGE',
       'PCT_65ABV', 'MED_AGE_M', 'MED_AGE_F', 'MALE', 'FEMALE',
       'AVE_HH_SZ', 'OWNER', 'RENTER', 'AVE_FAM_SZ', 'FAMILIES',
       'HOUSEHOLDS', 'FGDLAQDATE', 'LOGRECNO', 'PH_TOTAL', 'PH_FAM',
       'PH_NONFAM', 'FAM_HH', 'HABVBELOW', 'HBELOW_POV', 'HABOVE_POV',
       'ABVE_BELW', 'ABOVE_POV', 'BELOW_POV', 'ED_TOTAL', 'ED_LESS9TH',
       'ED_12NODIP', 'HSGRAD', 'ED_SOMECOL', 'ED_COLLEGE', 'BACHELORS',
       'TRAN_TOTAL', 'TRAN_CAR', 'TRAN_MOTO', 'TRAN_BIKE', 'TRAN_PUB',
       'TRAN_WALK', 'TRAN_OTHER', 'TRAN_HOME', 'ENROLLED', 'NOT_ENROLD',
       'LESS_10K', 'I10K_14K', 'I15K_19K', 'I20K_24K', 'I25K_29K',
       'I30K_34K', 'I35K_39K', 'I40K_44K', 'I45K_49K', 'I50K_59K',
       'I60K_74K', 'I75K_99K', 'I100K_124K', 'I125K_149K', 'I150K_199K',
       'I200KMORE', 'MEDHHINC', 'MEDFINCOME', 'HH_NOPUBA', 'HH_PUBA',
       'MEDOOHVAL', 'H1ATTACH', 'H1DETACH', 'H2UNIT', 'H3_4UNIT',
       'H5_9UNIT', 'H10_19UNIT', 'H20_49UNIT', 'H50MORE', 'MOBILE',
       'OTHERHOUSE', 'H_SF', 'H_MF', 'OWN05_10', 'RENT05_10', 'B05_10',
       'B00_04', 'B90_99', 'B80_89', 'B70_79', 'B60_69', 'B50_59',
       'B40_49', 'BEFORE39', 'M05_10', 'M00_04', 'M90_99', 'M80_89',
       'M70_79', 'M69BEFORE', 'VEHICLE_0', 'VEHICLE_1', 'VEHICLE_2',
       'VEHICLE_3', 'VEHICLE_4', 'VEHICLE5G', 'S_TOTAL', 'S_VERYWELL',
       'S_WELL', 'S_NOTWELL', 'S_NOTATALL', 'S_ENGLISH', 'S_SPANISH',
       'S_EUROPE', 'S_ASIAN', 'S_OTHER', 'LABOR_CIV', 'RTOTAL', 'RU50',
       'R50_99', 'R1_124', 'R125ABV', 'RU1', 'PCT_RU50', 'PCT_R50_9',
       'PCT_R125AB', 'PCT_NOTWEL', 'PCT_NOTATA', 'DEN_NOTWEL',
       'DEN_NOTATA', 'PCT_OWN5', 'PCT_RENT5', 'PCT_BACHLR', 'PCT_POV',
       'PCT_RU1', 'DATAYEAR', 'DESCRIPT', 'Shape_Length', 'Shape_Area'],
      dtype=object)
3.1 A simple scatter plot#
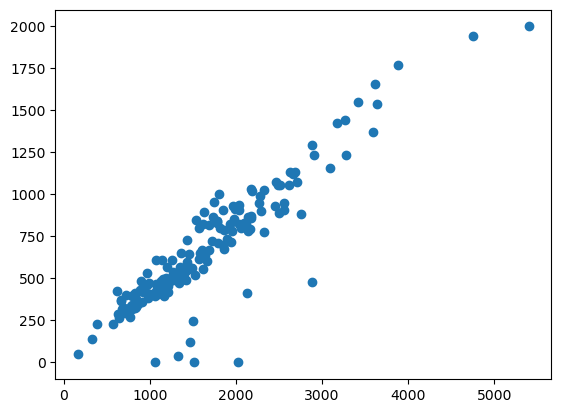
fig, axis = plt.subplots()
axis.scatter(blkgrp_df["TOTALPOP"], blkgrp_df["HOUSEHOLDS"])
<matplotlib.collections.PathCollection at 0x2658bc49810>
3.2 Figure size#
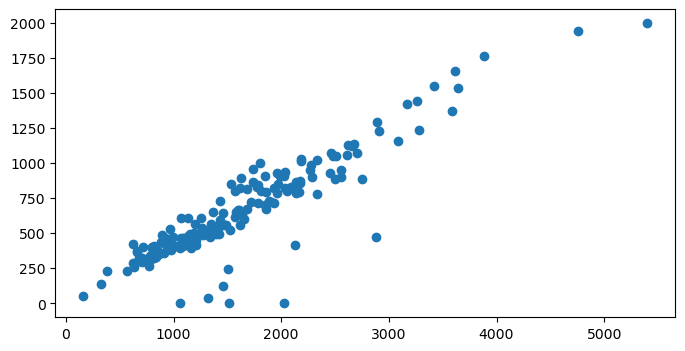
We can customize the figure size by changing figsize and assign a tuple
of (<width>, <height>)
fig, axis = plt.subplots(figsize=(8, 4))
axis.scatter(blkgrp_df["TOTALPOP"], blkgrp_df["HOUSEHOLDS"])
<matplotlib.collections.PathCollection at 0x2658bc63bd0>
3.3 Title and label#
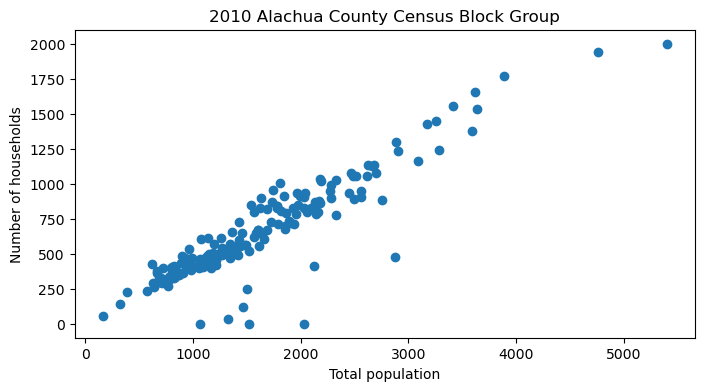
We can change the table of x and y axes and the title of the figure by using following functions:
set_xlabel()set_ylabel()set_title()
fig, axis = plt.subplots(figsize=(8, 4))
axis.scatter(blkgrp_df["TOTALPOP"], blkgrp_df["HOUSEHOLDS"])
axis.set_xlabel("Total population")
axis.set_ylabel("Number of households")
axis.set_title("2010 Alachua County Census Block Group")
Text(0.5, 1.0, '2010 Alachua County Census Block Group')
3.4 Color and marker#
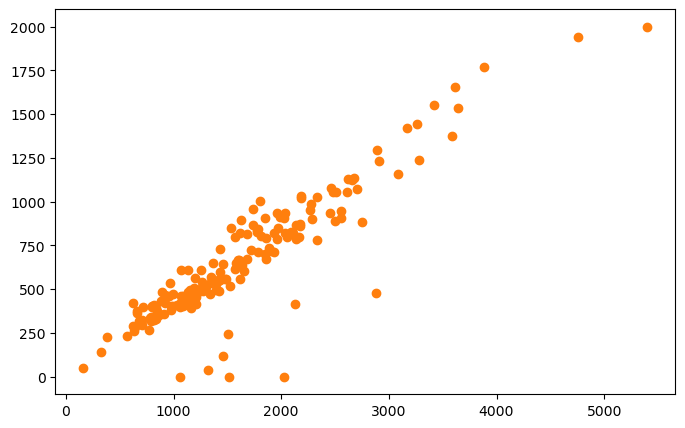
In Matplotlib to change color, you can pick any color names
below and supply the value as a str to the color argument, or the equivalent c.


fig, axis = plt.subplots(figsize=(8, 5))
axis.scatter(blkgrp_df["TOTALPOP"],
             blkgrp_df["HOUSEHOLDS"],
             color="tab:orange")
<matplotlib.collections.PathCollection at 0x2658c25d010>
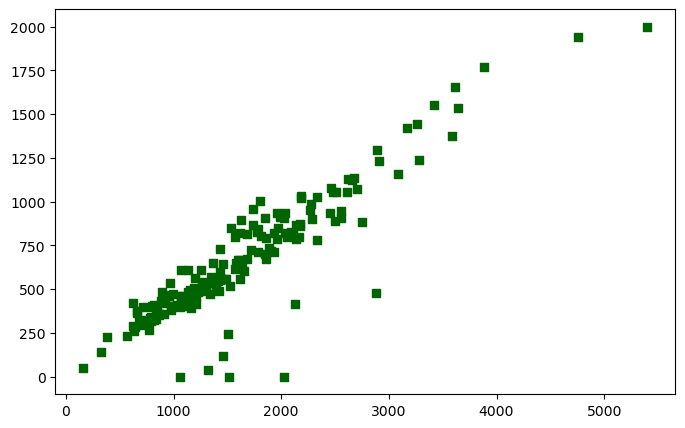
You can change a marker’s “shape” by setting the marker argument or m.
fig, axis = plt.subplots(figsize=(8, 5))
axis.scatter(blkgrp_df["TOTALPOP"],
             blkgrp_df["HOUSEHOLDS"],
             color="darkgreen",
             marker='s')
<matplotlib.collections.PathCollection at 0x2658c3dda10>
3.5 Marker size#
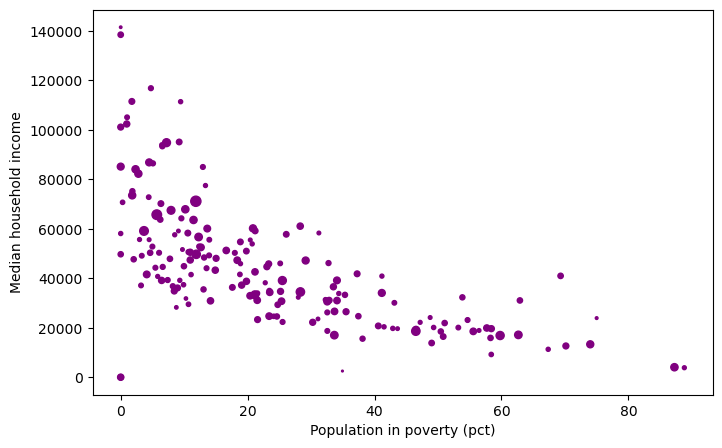
You can set marker’s size by the argument s.
fig, axis = plt.subplots(figsize=(8, 5))
axis.scatter(blkgrp_df["PCT_POV"],
             blkgrp_df["MEDHHINC"],
             color="purple",
             s=blkgrp_df['TOTALPOP']/100)
axis.set_xlabel("Population in poverty (pct)")
axis.set_ylabel("Median household income")
Text(0, 0.5, 'Median household income')
4. Bar plot#
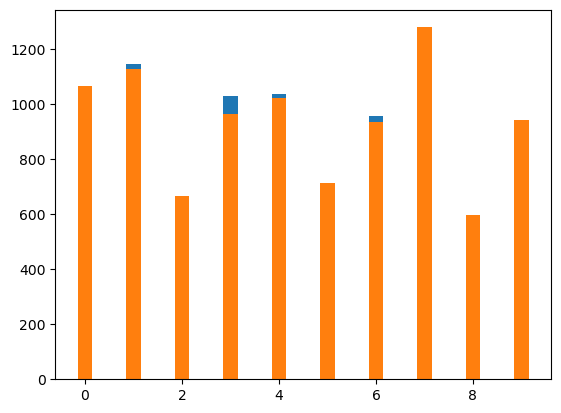
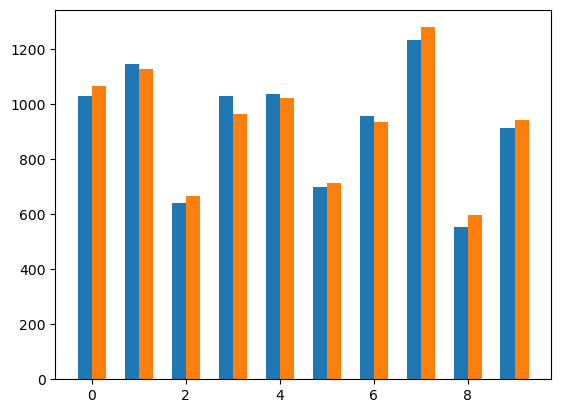
Bar plot displays rectangular bars with lengths proportional to the values that they represent. Bar plots are often used to compare the sizes or frequencies of different categories of data.
use
bar()to plotthe
widthargument
fig, axis = plt.subplots()   # tuple unpacking
axis.bar(np.arange(10),
         blkgrp_df["FEMALE"][:10],
         width=0.3,
         color="tab:blue")
axis.bar(np.arange(10),
         blkgrp_df["MALE"][:10],
         width=0.3,
         color="tab:orange")
<BarContainer object of 10 artists>
fig, axis = plt.subplots()   # tuple unpacking
axis.bar(np.arange(10) - 0.15,
         blkgrp_df["FEMALE"][:10],
         width=0.3,
         color="tab:blue")
axis.bar(np.arange(10) + 0.15,
         blkgrp_df["MALE"][:10],
         width=0.3,
         color="tab:orange")
<BarContainer object of 10 artists>
4.1 Legend#
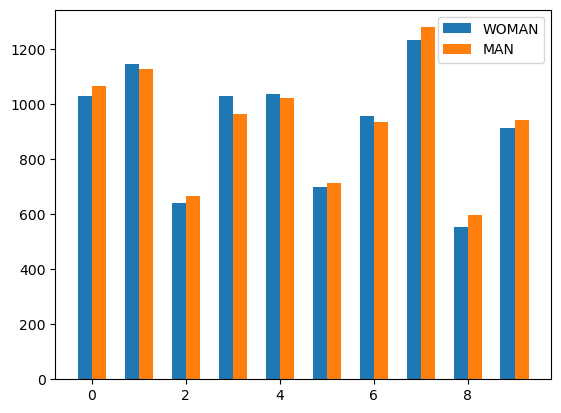
The legend is used to help identify which plot element corresponds to which data series, especially when multiple data series are displayed on the same plot.
set the
labelargumentuse the
legend()function
fig, axis = plt.subplots()   # tuple unpacking
axis.bar(np.arange(10) - 0.15,
         blkgrp_df["FEMALE"][:10],
         width=0.3,
         color="tab:blue",
         label="WOMAN")
axis.bar(np.arange(10) + 0.15,
         blkgrp_df["MALE"][:10],
         width=0.3,
         color="tab:orange",
         label="MAN")
axis.legend()
<matplotlib.legend.Legend at 0x2658c4e4c50>
Here are the integer values that correspond to each location:
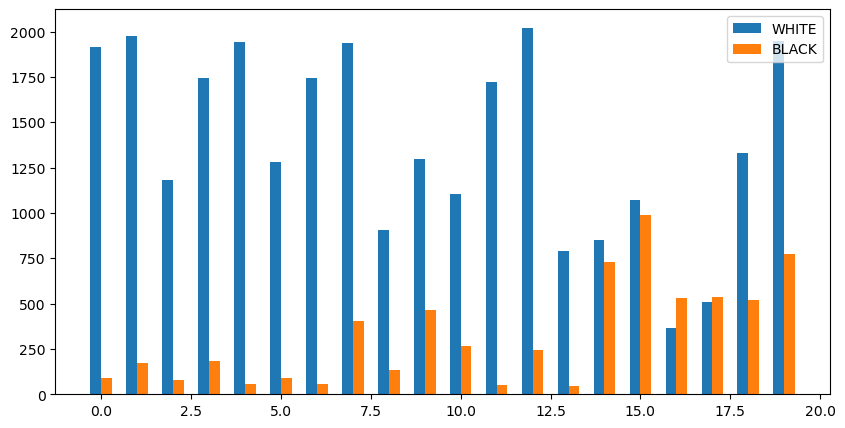
0: ‘best’1: ‘upper right’2: ‘upper left’3: ‘lower left’4: ‘lower right’5: ‘right’6: ‘center left’7: ‘center right’8: ‘lower center’9: ‘upper center’10: ‘center’
fig, axis = plt.subplots(figsize=(10, 5))
axis.bar(np.arange(20) - 0.15,
         blkgrp_df["WHITE"][:20],
         width=0.3,
         color="tab:blue",
         label="WHITE")
axis.bar(np.arange(20) + 0.15,
         blkgrp_df["BLACK"][:20],
         width=0.3,
         color="tab:orange",
         label="BLACK")
axis.legend(loc=1)  # or axis.legend(loc='upper right')
<matplotlib.legend.Legend at 0x2658ca21890>
5. Histogram#
A histogram is a graphical representation of the distribution of a dataset. It shows the frequency of data points that fall within equal intervals or bins.
To create a histogram, use the hist() function.
fig, axis = plt.subplots()
axis.hist(blkgrp_df["TOTALPOP"])
(array([11., 55., 45., 35., 18.,  7.,  4.,  1.,  1.,  1.]),
 array([ 163. ,  686.5, 1210. , 1733.5, 2257. , 2780.5, 3304. , 3827.5,
        4351. , 4874.5, 5398. ]),
 <BarContainer object of 10 artists>)
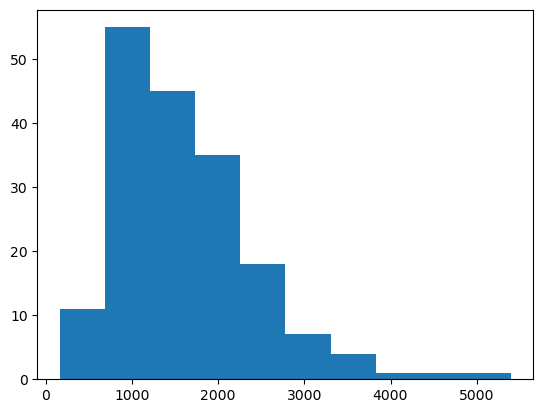
By default, bins is set to 10, which means that the data will be divided
into 10 equal-width bins. In a histogram, the bin size determines the width
of each bin, which in turn determines the range of values that are grouped together
and counted. A smaller bin size will result in more bins and more detail in the
distribution of the data, while a larger bin size will result in fewer bins and less detail.
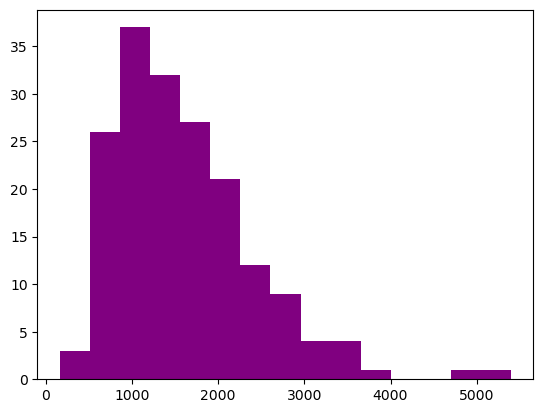
The choice of bin size is important in constructing a meaningful histogram, as it can affect the visual representation of the data and the interpretation of the distribution. A bin size that is too small may result in an overly detailed and noisy histogram, while a bin size that is too large may obscure important features of the distribution.
fig, axis = plt.subplots()
axis.hist(blkgrp_df["TOTALPOP"],
          bins=15,
          color="purple")
(array([ 3., 26., 37., 32., 27., 21., 12.,  9.,  4.,  4.,  1.,  0.,  0.,
         1.,  1.]),
 array([ 163.,  512.,  861., 1210., 1559., 1908., 2257., 2606., 2955.,
        3304., 3653., 4002., 4351., 4700., 5049., 5398.]),
 <BarContainer object of 15 artists>)
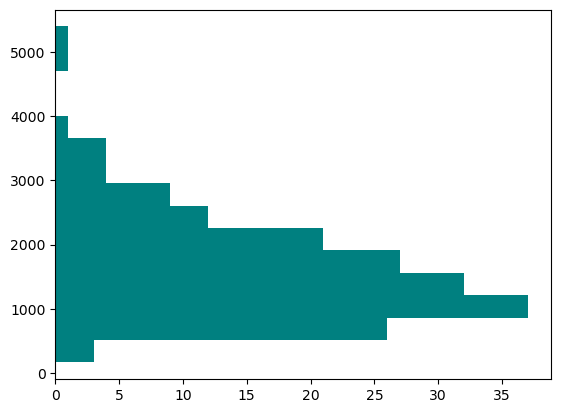
fig, axis = plt.subplots()
axis.hist(blkgrp_df["TOTALPOP"],
          bins=15,
          color="teal",
          orientation="horizontal")
(array([ 3., 26., 37., 32., 27., 21., 12.,  9.,  4.,  4.,  1.,  0.,  0.,
         1.,  1.]),
 array([ 163.,  512.,  861., 1210., 1559., 1908., 2257., 2606., 2955.,
        3304., 3653., 4002., 4351., 4700., 5049., 5398.]),
 <BarContainer object of 15 artists>)
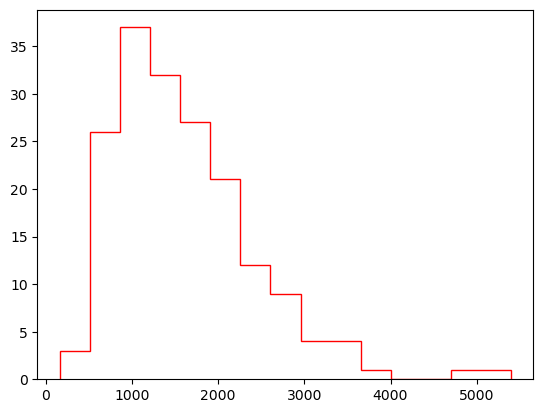
fig, axis = plt.subplots()
axis.hist(blkgrp_df["TOTALPOP"],
          bins=15,
          color="red",
          histtype="step")
(array([ 3., 26., 37., 32., 27., 21., 12.,  9.,  4.,  4.,  1.,  0.,  0.,
         1.,  1.]),
 array([ 163.,  512.,  861., 1210., 1559., 1908., 2257., 2606., 2955.,
        3304., 3653., 4002., 4351., 4700., 5049., 5398.]),
 [<matplotlib.patches.Polygon at 0x2658c9cd290>])
5.1 Display two plots side by side#
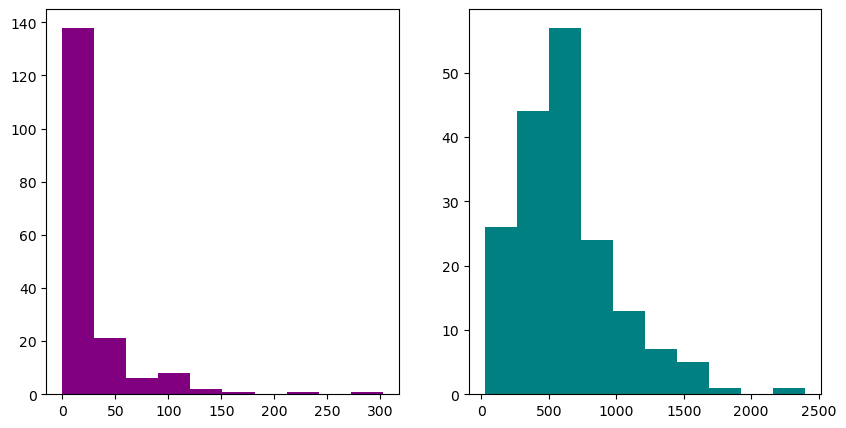
Each axis is an element of the axes list.
fig, axes = plt.subplots(nrows=1, ncols=2, figsize=(10, 5))
axes[0].hist(blkgrp_df["TRAN_BIKE"], color="purple")
axes[1].hist(blkgrp_df["TRAN_CAR"], color="teal")
(array([26., 44., 57., 24., 13.,  7.,  5.,  1.,  0.,  1.]),
 array([  27. ,  264.4,  501.8,  739.2,  976.6, 1214. , 1451.4, 1688.8,
        1926.2, 2163.6, 2401. ]),
 <BarContainer object of 10 artists>)
Tip
Use plt.tight_layout() to have a more compact figure.
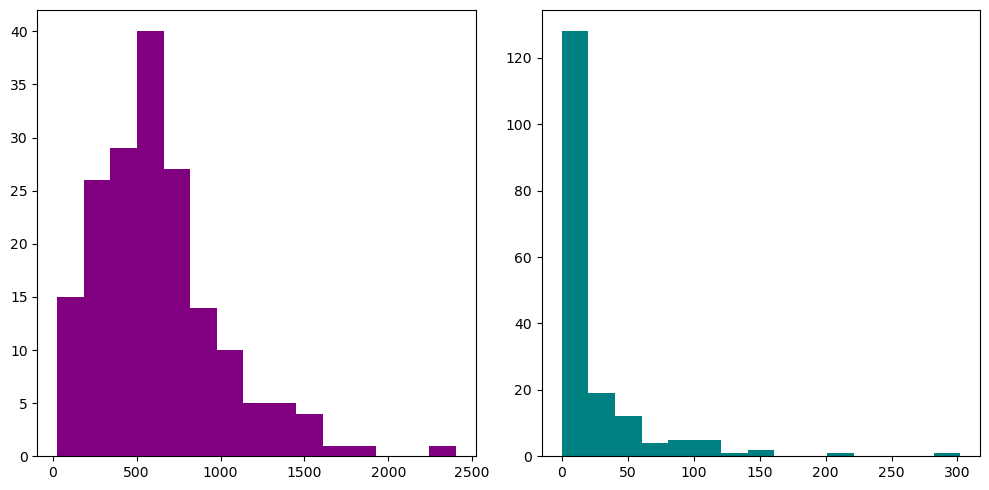
fig, axes = plt.subplots(nrows=1, ncols=2, figsize=(10, 5))
axes[0].hist(blkgrp_df["TRAN_CAR"], bins=15, color="purple")
axes[1].hist(blkgrp_df["TRAN_BIKE"], bins=15, color="teal")
plt.tight_layout()
